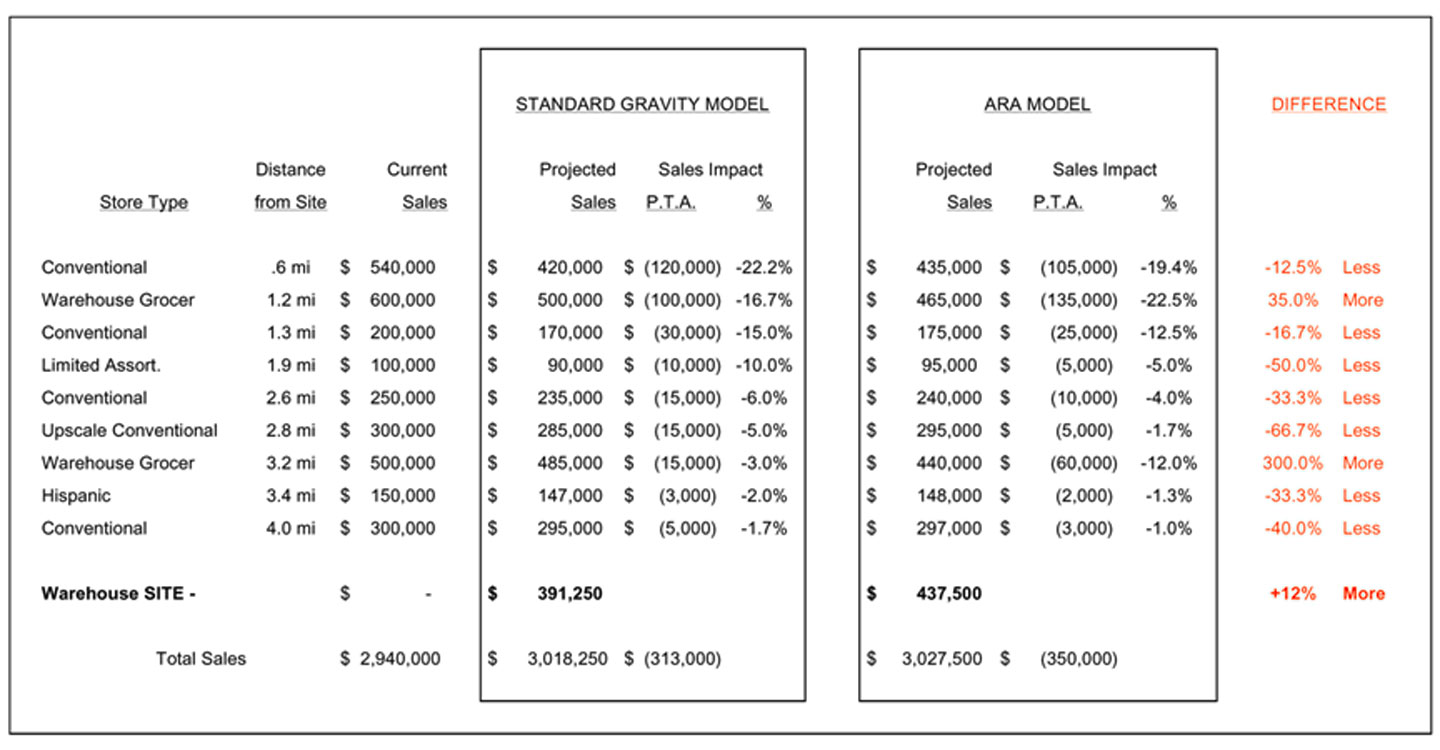
The example below compares sales projections for a proposed grocery warehouse operation using a standard gravity model and a custom ARA model. The ARA model is able to “see” operational variance and links it to underlying demographics of the population, producing a more realistic simulation of actual consumer behavior. Note that the sales impacts from the site on similar stores are much more pronounced using the ARA model while those on dissimilar niche operators (such as an upscale grocer) are considerably less. This difference reflects numerous examples of actual sales redistributions that ARA has observed, particularly in more diverse trade areas.

